Material strength is a foundation of engineering and design, and stress is defined as the internal resistance per unit area that materials generate when subjected to external loads. Tensile and compressive stresses arise from stretching and squeezing forces, respectively, and their calculation depends on the force applied and the cross-sectional area. Yield stress indicates the onset of permanent deformation. In structures, machinery, and products, understanding
Today, we are going to present a close look at tensile stress, compressive stress, and yield stress by going over their definitions, symbols, formulas, and real-world applications to figure out the differences and connections between these types of stress, which will ensure that safe and functional structure design in CNC machinery and engineering!
Tensile vs Compressive vs Yield Stress in Materials and Engineering
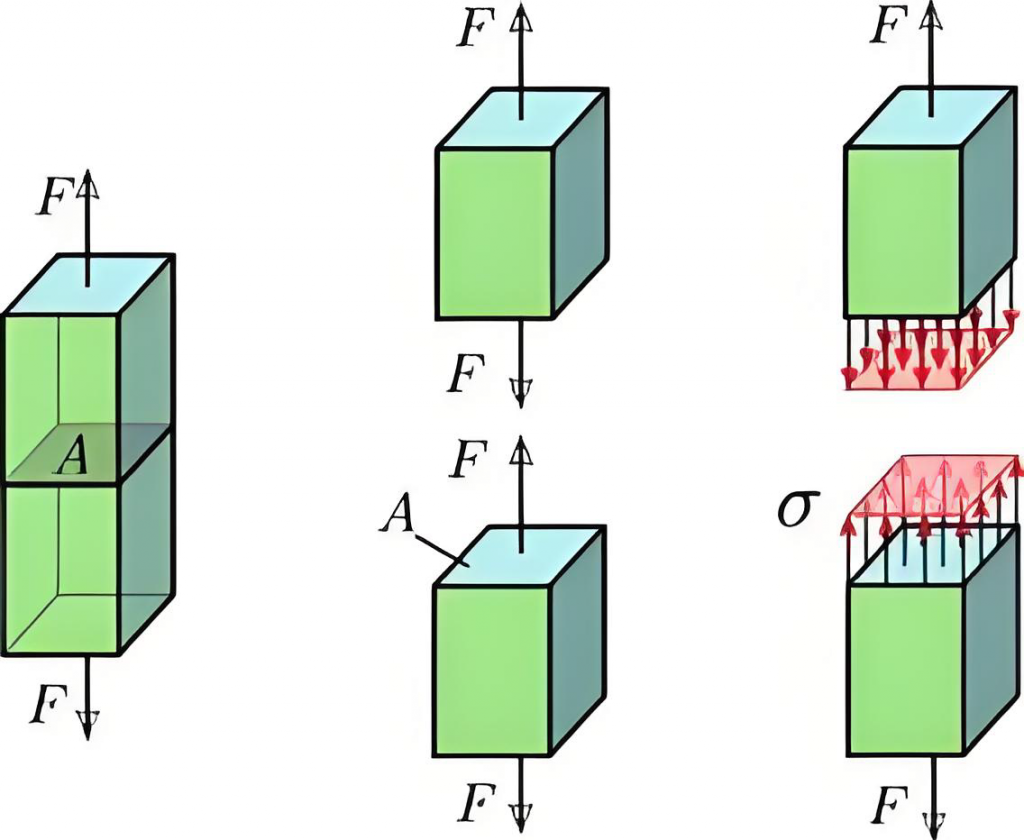
When a force acts on a body, it tries to change the shape or size of the object. The internal resistance per unit area that develops to counteract this deformation is called stress. Mathematically, stress is defined as the force divided by the area over which it is applied:
σ = F / A
Where:
- σ = stress (Pa or MPa)
- F = applied force (N)
- A = cross-sectional area (m²)
Materials are elastic in nature, meaning they deform under force but can return to their original shape if the force is removed before a certain limit. Beyond this limit, permanent deformation occurs. The way a material responds to different types of force, pulling, pushing, or shearing, leads to different kinds of stress, each with its own role in engineering.
1. What is Tensile Stress?
Tensile Stress Definition
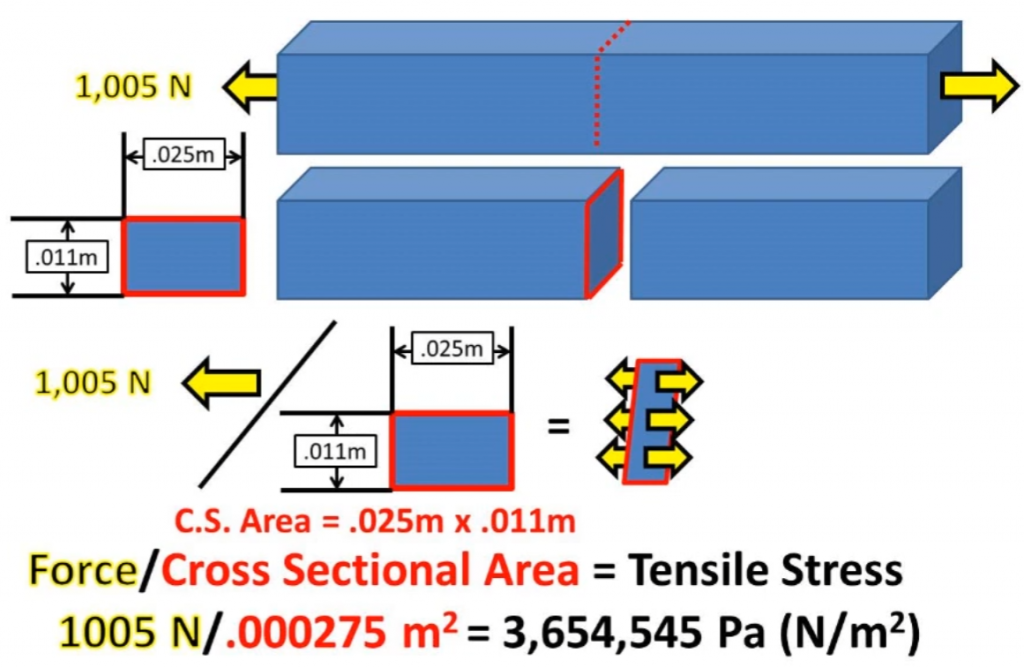
Tensile stress describes the internal resistance that develops within a material when subjected to a stretching force. When a force acts on a body and attempts to change its shape by pulling it along its length, the internal molecules of the material resist this change. This resistance is quantified as stress. In materials mechanics, tensile stress is the ratio of the applied tensile force to the cross-sectional area over which the force is distributed.

Tensile Stress Units
Tensile stress is measured in units of pressure. The standard SI unit is the Pascal (Pa), which equals one Newton per square meter (N/m²). For engineering and practical calculations, larger units such as Megapascal (MPa) or Newton per square millimeter (N/mm²) are commonly used.
Tensile Stress Symbol
In equations and technical documents, tensile stress is typically represented by the Greek letter sigma, σ. For example, σ = N / A, where σ stands for tensile stress, N is the applied force, and A is the cross-sectional area.
Tensile Stress Diagram
A stress-strain diagram visually represents how a material behaves under tension. On this graph, stress is plotted along the vertical axis (y-axis), and strain is plotted along the horizontal axis (x-axis). As a tensile force is applied, the material elongates, and corresponding points are plotted to form a curve. Initially, the curve is linear, indicating that stress is directly proportional to strain—this is known as the proportionality or elastic region. The material can fully recover its shape if the stress is removed within this region. As loading continues, the curve becomes non-linear, reaching the elastic limit and then the yield point, beyond which permanent (plastic) deformation occurs. The point where the curve reaches its maximum is the ultimate tensile strength, and fracture occurs shortly after.

Tensile Stress Diagram
Tensile Stress Area of Bolt
When analyzing bolts under tension, the area used for stress calculation is the cross-sectional area at the narrowest part, typically at the threads. In the case of bolts or rods, the cross-sectional area is typically considered as the area of a circle, calculated using the formula:
Area = π × (radius)2
For example, if a tendon or rod has a diameter of 9mm, its radius is 4.5mm or 0.0045m, and the area would be π×(0.0045)2 square meters.
Tensile Stress vs Tensile Strength
Tensile stress refers to the internal force per unit area within a material when subjected to tension. In contrast, tensile strength (also called ultimate tensile strength) is the highest stress a material can endure before breaking. While tensile stress varies with the applied force, tensile strength is a property of the material itself. For example, tensile strength is a helpful measurement for determining if a material can withstand the expected stresses in a design, especially in applications involving adhesives or joints.
Tensile Strength on Stress-Strain Curve
On the stress-strain curve, the highest point reached before the material fractures is called the ultimate tensile strength. In brittle materials, the ultimate tensile strength is close to the yield point, meaning the material breaks with little plastic deformation. In ductile materials, the ultimate tensile strength is usually higher than the yield strength, allowing more deformation before breaking.
Tensile Stress Formula & Calculation
Tensile Stress Equation
The basic mathematical relationship for tensile stress is:
σ = N / A
where:
- σ is the tensile stress (Pa or MPa),
- N is the applied tensile force (N),
- A is the cross-sectional area at the point of application (m²).
This formula assumes a uniform distribution of stress across the area.

Ultimate & Maximum Tensile Stress Formula
The ultimate tensile stress or maximum tensile stress can be found using the same relationship, but with the maximum force the material can handle before failure:
σmax = Nmax / Amin
Here, Nmax is the greatest force the material can withstand, and Amin is the minimum cross-sectional area, usually at the weakest point.
Average Tensile Stress Formula
For average tensile stress in a component:
σavg = N / A
This is suitable for situations where stress is evenly distributed.
Tensile Stress Calculation Example
Example 1: Stretching a Tendon
Suppose a tendon, 20 cm long with a diameter of 9 mm, is stretched by 4 mm under a force of 14 Newtons. The area of the tendon (assumed circular) is calculated as follows:
- Radius = 9mm ÷ 2 = 4.5mm = 0.0045m
- Area A = π × (0.0045)2 ≈ 6.36 × 10⁻⁵m²
The tensile stress is:
σ = 14N ÷ (6.36 × 10⁻⁵m2) ≈ 220,000Pa = 0.22MPa
The strain is the change in length divided by the original length:
ϵ = 0.004m ÷ 0.20m = 0.02
Young’s modulus, a measure of the material’s stiffness, would be:
E = σ ÷ ϵ = 220,000 ÷ 0.02 = 11,000,000Pa = 11MPa
Example 2: Nylon Cord Lifting a Box
If a nylon cord with a diameter of 1.15 mm and an ultimate strength of 500×106500 \times 10^6500×106 N/m² is used to lift a box, the maximum load before snapping can be calculated:
- Radius = 1.15mm ÷ 2 = 0.575mm = 0.000575m
- Area A = π × (0.000575)2 ≈ 1.04 × 10⁻⁶m²
Maximum force:
Nmax = 500 × 106N/m2 × 1.04 × 10−6m2 ≈ 520N
2. What is Compressive Stress?
Compressive Stress Definition
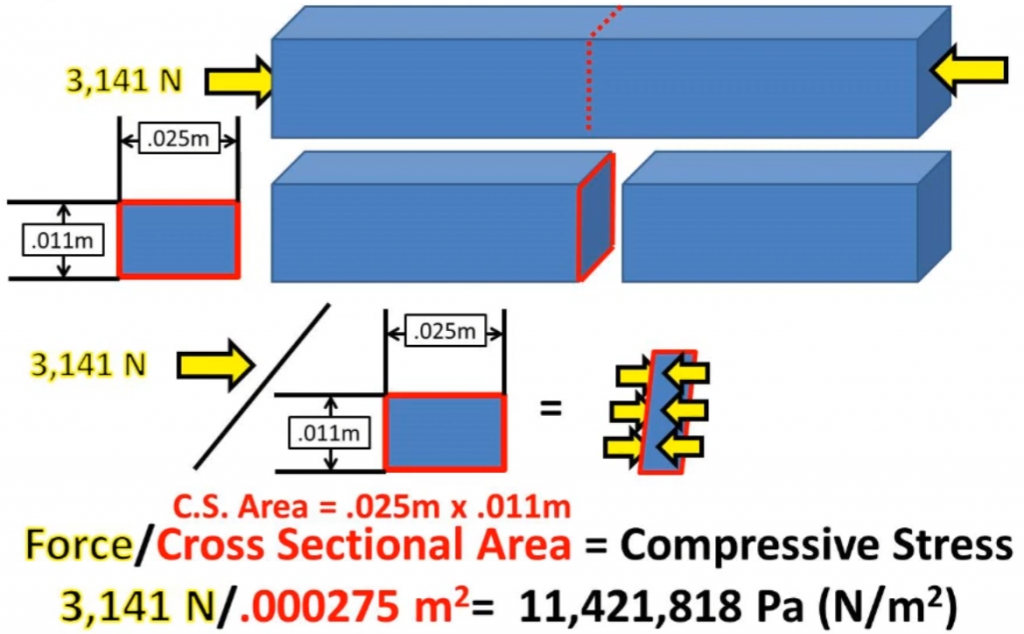
Compressive stress is the internal resistance developed in a material when it is subjected to forces that attempt to push its ends toward each other, causing the material to shorten. When both ends of a section are pushed by equal and opposite forces, the object is under compression. The resulting longitudinal stress in the material is called compressive stress. For example, if a cylinder is compressed at both ends, the stress along its axis is compressive. This form of stress not only appears during direct loading, but can also emerge in cases such as thermal expansion or bending, where the inner side of a beam under bending experiences compressive stress.

Compressive Stress Units
The unit for compressive stress is the Pascal (Pa), which is equal to one Newton per square meter (N/m²). In engineering, compressive stress often appears in larger units such as Megapascals (MPa).
Compressive Stress Symbols
Compressive stress is commonly represented by the Greek letter sigma: σ. In calculations, compressive stress is usually assigned a negative value to distinguish it from tensile stress, which is considered positive.
Compressive Stress Diagram
A typical compressive stress diagram shows a bar or column with arrows pointing inward from both ends, illustrating the direction of the compressive forces. As these forces are applied, the length of the object reduces, visually demonstrating how the material shortens under compression.

Compressive Stress Area of Bolt
For a bolt or column under compressive load, the area used to calculate compressive stress is the cross-sectional area at the location where the force is applied. For a round bolt, this is found using the formula πr², where r is the radius of the bolt. The area is a fundamental factor in determining how much stress the material experiences under a given load.
Compressive Stress vs Compressive Strength
Compressive stress refers to the internal force per unit area that resists the tendency of an object to be compressed. Compressive strength, on the other hand, is the maximum compressive stress a material can withstand before failing or fracturing. In many materials, such as concrete, compressive strength is much higher than tensile strength, meaning the material resists crushing much more than stretching.
Compressive Strength on Stress-Strain Curve
The compressive stress-strain curve plots compressive stress (vertical axis) against strain (horizontal axis). For ductile materials like low-carbon steel, the curve displays both elastic and yield stages during compression, similar to tension. For brittle materials such as cast iron, the compressive strength can be three to four times higher than their tensile strength, and the curve rises steeply before failure. The peak of the curve before the material crushes indicates the compressive strength.
Compressive Stress Formula & Calculation
Compressive Stress Equation
The general formula for compressive stress is:
σ = F / A
where:
- σ is the compressive stress (Pa or MPa),
- F is the compressive force (N),
- A is the cross-sectional area (m²).

Maximum Compressive Stress Formula
The maximum compressive stress that a section can withstand is given by:
σmax = Fmax ÷ Amin
Here, Fmax is the largest compressive force the material can endure, and Amin is the smallest cross-sectional area at the point of loading.
Allowable Compressive Stress Formula
The allowable compressive stress for concrete or similar materials, especially in structural design, sometimes involves an increased coefficient:
σallowable = β ⋅ [σa] ⋅ (Ac/A)
where:
- [σa] is the allowable compressive stress under central compression,
- β is the stress increase coefficient (often between 2 and 2.5 for specific applications),
- Ac is the local bearing area,
- A is the total cross-sectional area.
Compressive Stress Calculation Example
Example: Compression of a Brass Rod
Consider a brass rod with a diameter of 30 cm positioned vertically. If a person with a mass of 80 kg stands on the rod, the compressive force is simply their weight:
F = m⋅g = 80 kg × 9.8 m/s2 = 784N
The area is:
Diameter = 30cm = 0.3m ⟹ r = 0.3 ÷ 2 = 0.15m
A = πr2 = π × (0.15)2 ≈ 0.0707m2
So the compressive stress:
σ = 784 ÷ 0.0707 ≈ 11,090Pa = 0.011MPa
If Young’s modulus for brass is 100×109N/m2, the fractional decrease in length is calculated using the relationship between stress and strain. Each atom throughout the brass rod moves closer to its neighbor by the same fractional value as the rod’s overall compression.
3. What is Yield Stress?
Yield Stress Definition
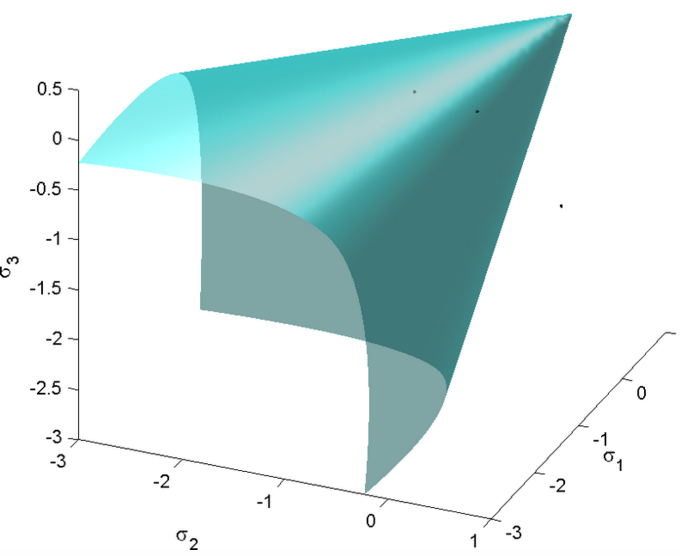
Yield stress is the amount of stress at which a material transitions from elastic behavior to plastic behavior, meaning it starts to deform permanently. For fluids and structured liquids, yield stress refers to the stress required to initiate continuous flow. In solids such as metals, it is the maximum stress that can be applied before the material begins to undergo permanent shape change. If a material is stressed below its yield stress, it will recover its original shape once the force is removed; above this point, permanent deformation occurs.

In the context of rheology and semi-solids, yield stress is the value of applied stress where a structured liquid, such as mayonnaise or toothpaste, shifts from resisting deformation to flowing like a fluid. For example, toothpaste will not flow out of the tube until enough pressure (yield stress) is applied.
Yield Stress Units
Yield stress is measured in Pascals (Pa) in the International System of Units. For engineering materials, it is commonly reported in megapascals (MPa) due to the magnitude of the forces involved.
Yield Stress Symbol
The most commonly used symbol for yield stress is σy or τy (for shear yield stress). In engineering diagrams and equations, σy is typically used for normal (tensile/compressive) yield stress, while τy is reserved for shear yield stress.
Yield Stress Diagram
A typical yield stress diagram involves a stress-strain or shear stress-shear rate curve.
- In solids, the yield point is marked on a stress-strain graph as the point where the curve departs from linearity and permanent deformation begins.
- In fluids or semi-solids, plotting shear stress against shear rate, the curve for a Newtonian fluid passes through the origin (yield stress ≈ 0), but for a Bingham plastic (like toothpaste or paint), the curve shows a nonzero y-intercept representing the yield stress.

Yield Stress Area of Bolt
For bolts and similar structural members, the area used to calculate yield stress is the minimum cross-sectional area where yielding is expected to occur, typically at the threaded section. The yield stress is calculated using the actual area at this location, as this is where permanent deformation will initiate under load.
Yield Stress vs Yield Strength
Yield stress and yield strength are closely related terms. Yield stress refers to the specific value of stress at which a material yields (starts to deform permanently), while yield strength is the maximum stress that can be applied before this permanent deformation begins. For practical purposes in engineering, these terms are often used interchangeably. The yield strength is a crucial property when selecting materials for structures, as it defines the maximum load a material can handle without permanent deformation.
Yield Strength on Stress-Strain Curve
On a stress-strain curve, the yield strength is identified as the point where the curve starts to level off after the initial linear (elastic) region. This is where strain increases more rapidly with little or no increase in applied stress, signifying the onset of plastic deformation. According to standards such as IS 1786:2008, it is the stress at which elongation begins without increasing the load during a tensile test.
Yield Stress Formula & Calculation
Yield Stress Equation
The general equation to calculate yield stress is:
σy = Fy / A
where:
- σy = yield stress (Pa or MPa)
- Fy = applied force at yield (N)
- A = cross-sectional area (m²)
Maximum Yield Stress Formula
The maximum yield stress is calculated using the highest force the material can handle before yielding, divided by the minimum cross-sectional area:
σy, max = Fy, max / Amin
Allowable Yield Stress Formula
Allowable yield stress is set by design codes and standards to provide a safety margin. It is typically a fraction of the actual yield strength of the material:
σallowable = σy / Safety Factor
The safety factor ensures the structure remains safe under expected loads.
Yield Stress Calculation Example
Suppose a steel bolt has a minimum cross-sectional area of 200mm² (0.0002m²) and yields under a load of 60,000N. The yield stress can be calculated as:
σy = 60,000N / 0.0002m² = 300,000,000Pa = 300MPa
If the design code requires a safety factor of 1.5, the allowable yield stress is:
σallowable = 300MPa / 1.5 = 200MPa
4. Tensile Stress vs Compressive Stress vs Yield Stress: Differences
Based on the above introduction of each type of stress, below we are going to use a clear table to sort out the main differences between tensile stress, compressive stress, and yield stress:
| Aspect | Tensile Stress | Compressive Stress | Yield Stress |
|---|---|---|---|
| Definition | Stress developed by forces that pull/stretch a material | Stress developed by forces that push/shorten a material | The stress at which a material begins to deform plastically |
| Type of Force | Pulling (tension) | Pushing (compression) | Associated with both tension and compression |
| Effect on Material | Elongates (increases length) | Shortens (decreases length) | Marks end of elastic behavior; permanent deformation starts |
| Formula | σ = F / A (Force divided by Area) | σ = F / A (Force divided by Area) | Determined from stress-strain curve; often at 0.2% offset |
| Usual Symbol | σ (or sometimes σt) | σ (or sometimes σc) | σy |
| Unit | Pascal (Pa) or N/m² | Pascal (Pa) or N/m² | Pascal (Pa) or N/m² |
| Testing Method | Tensile test (common and straightforward) | Compression test (common for brittle materials) | Derived from tensile or compression test |
| Direction of Force | Acts outward from center of section | Acts inward toward center of section | Not direction-specific; defined by onset of plasticity |
| Material Behavior | Ductile materials: values similar to compressive strength | Brittle materials: much higher compressive than tensile strength | Depends on material; commonly used as design limit |
| Failure Mode | Fracture or necking (ductile); sudden break (brittle) | Buckling (slender members), crushing/cracking (brittle) | Permanent (plastic) deformation occurs |
| Typical Value Range | Lower for brittle materials; higher for ductile (e.g., steel) | Much higher for brittle materials (e.g., concrete) | Less than ultimate strength, varies by material |
| Common Material Example | Steel rods, cables, metal wires | Concrete columns, masonry, ceramic blocks | Steel, aluminum, plastics |
| Behavior After Limit | May neck then fracture (ductile); break suddenly (brittle) | May crush, crack, or buckle | Irreversible shape change occurs |
| Directionality | Uniaxial (along axis of pulling force) | Uniaxial (along axis of pushing force) | Not direction-specific; occurs in both tension and compression |
| Dependence on Geometry | Less affected by buckling for short, thick members | Long, slender members may fail by buckling | Geometry can affect onset of yielding (e.g., stress concentration) |
| Temperature Sensitivity | Can decrease at higher temperatures | Can decrease at higher temperatures | Yield point drops as temperature rises |
| Design Consideration | Used for cables, tendons, tension members | Used for columns, piers, load-bearing walls | Used as the allowable limit in codes |
| Reversibility | Below yield, material returns to original shape | Below yield, material returns to original shape | Beyond yield, deformation is permanent |
| Common Testing Standard | ASTM E8 (tension test) | ASTM C39 (concrete compression) | Derived from ASTM E8, E9, etc. |
| Stress-Strain Curve | Slope in elastic region, ultimate strength at peak | Ultimate compressive strength for brittle materials | Point where curve departs from linearity (yield point) |
| Area Used in Formula | Cross-sectional area (e.g., A = πr² for rods/bolts) | Cross-sectional area (e.g., A = πr² for rods/bolts) | Same as for tensile/compressive stress |
| Practical Example | Weight hanging from a cable, stretching a rod | Building weight on a column, squeezing a block | Onset of permanent shape change in a steel bar |
| Load Example | Stretching or pulling a steel rod or bolt | Pushing or squeezing a concrete column | Yielding of steel under load |
5. Relation Between Tensile, Compressive, and Yield Stress
The mechanical behavior of materials under different types of stress is closely related. Here’s how they connect:
- Elastic Region:
In both tension and compression, materials initially deform elastically—stress is proportional to strain, as defined by Young’s modulus (E). This holds until the yield point. - Yield Point:
Yield stress marks the boundary between elastic and plastic behavior. Both tensile and compressive tests can identify yield stress, though for some materials (like mild steel), yield and ultimate strengths are similar in both tension and compression. - Material Differences:
Ductile materials (like steel) often have comparable tensile and compressive strengths. Brittle materials (like concrete) are much stronger in compression than in tension. For instance, concrete’s compressive strength (e.g., 20 MPa) is several times its tensile strength (e.g., 2 MPa). - Design Considerations:
Engineers use yield strength as a design limit to ensure structures don’t experience permanent deformation. Safety factors keep working stresses below the yield point, taking into account both tensile and compressive scenarios. - Formula Consistency:
The basic formula for stress (σ=F/A) applies to both tension and compression. The difference lies in the direction of force and the material’s response.

